Connect With Us
U.S. Office
1039 Chrome Rd.
Oxford, PA 19363
Headquarters
Vasvári Pál u. 1/C
9024 Győr
Hungary

It is certain that everybody has had similar thoughts when they were looking at financial options for a specific goal (e.g. buying a house).
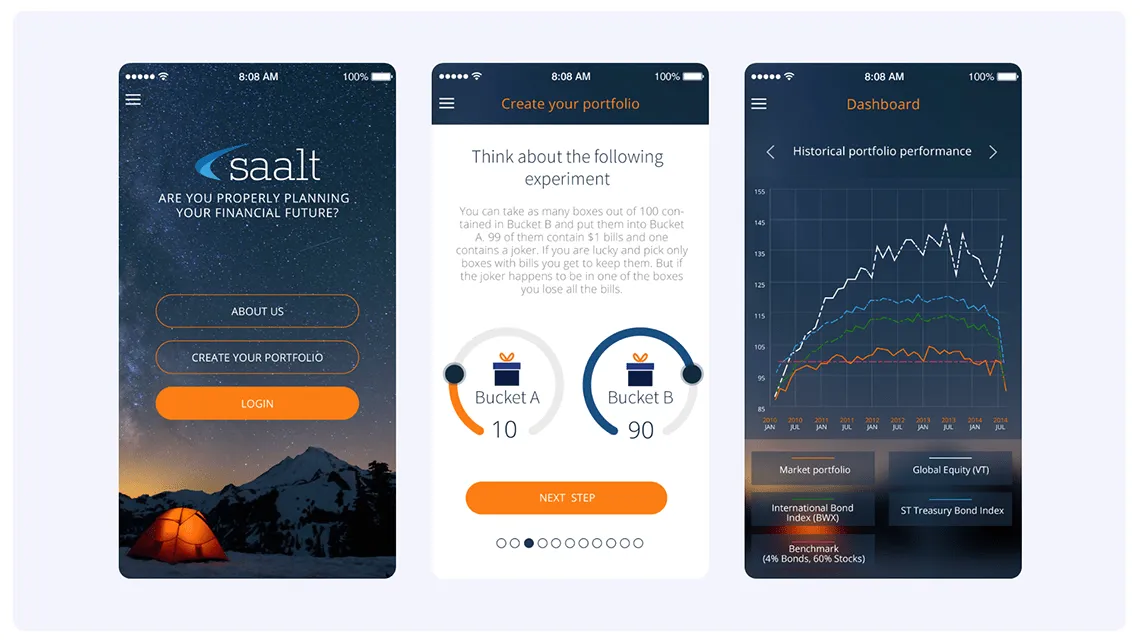
Our partner who previously served as an expert at the IMF in Washington DC designed a financial service that recommends users custom investment portfolios based on their personal characteristics. In other words, the solution translates intricate financial models into a process of steps that are easy to follow for everybody without a financial background.
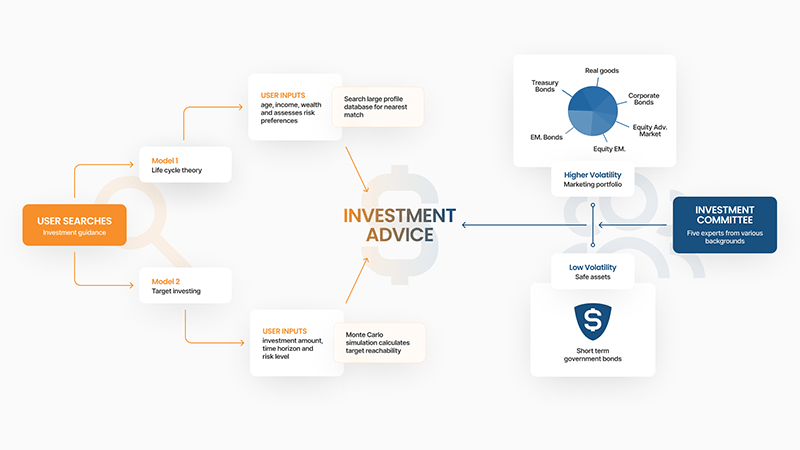
Saalt recommends two types of investment frameworks.
One composes the portfolio based on the user’s personal and financial situation. This relies on the so-called life cycle theory, where based on the number of our active working years as well as considering retirement, the system calculates the amount of savings we need to accumulate to maintain our current living standards. Our personal circumstances also influence the diversification of our portfolio.
Upon that we are able to compare our financial attitude to the ideal attitude recommended by the model, and decide if it is sustainable long-term. The system then chooses the portfolio most suitable for our profile from the wide range of pre-generated portfolios in the database.
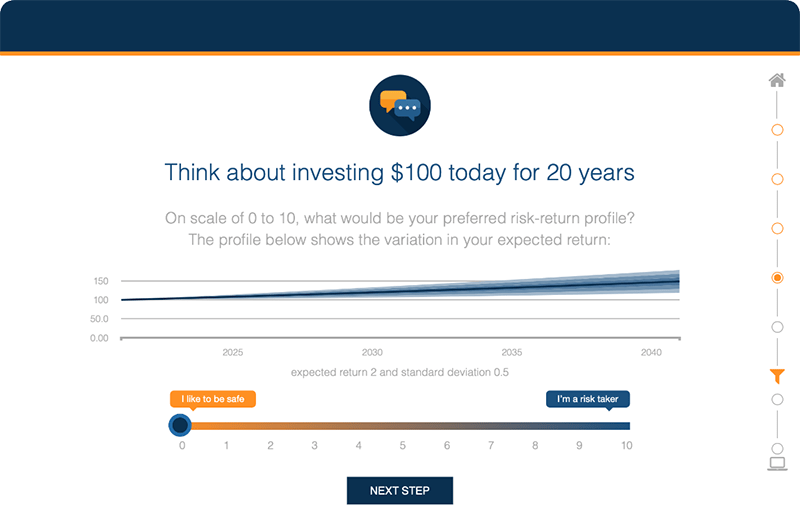
The second framework does not require personal data, but the user has to declare their risk preferences and their preferred investment horizon. For this model we can define a specific financial goal we want to achieve, and the system tells us the time frame and likeliness of reaching that goal.

The financial portfolio is accumulated by a diverse team of 5 investment experts (Investment Committee) using computer simulation and it is fully customized to the client’s preferences. The clients are able to follow the accumulation of the portfolio on their personal account. The system also has several addition functions, such as:

During our partnership we created the following modules:
The most exciting task was data visualization as we had to use various graphs - all of them were interactive - to describe the different financial models. This means that by moving the mouse on the graph, more information is shown about the specific point. Responsiveness was understandably a vital requirement for this project, so our team had to make sure that the charts appeared correctly on all screen sizes.
Another challenge was that both the mobile and the web applications worked with the same source with regards to the graphs, but while the background for the website had to be white, the applications’ background had to be dark. As a result, we developed a custom appearance component (Custom Chart Modularization).
Technologies: SVG, D3JS

1039 Chrome Rd.
Oxford, PA 19363
Vasvári Pál u. 1/C
9024 Győr
Hungary